Echarts柱状图组件的封装和使用
简单封装ECharts柱形图,折线图,饼图。
·
效果图:
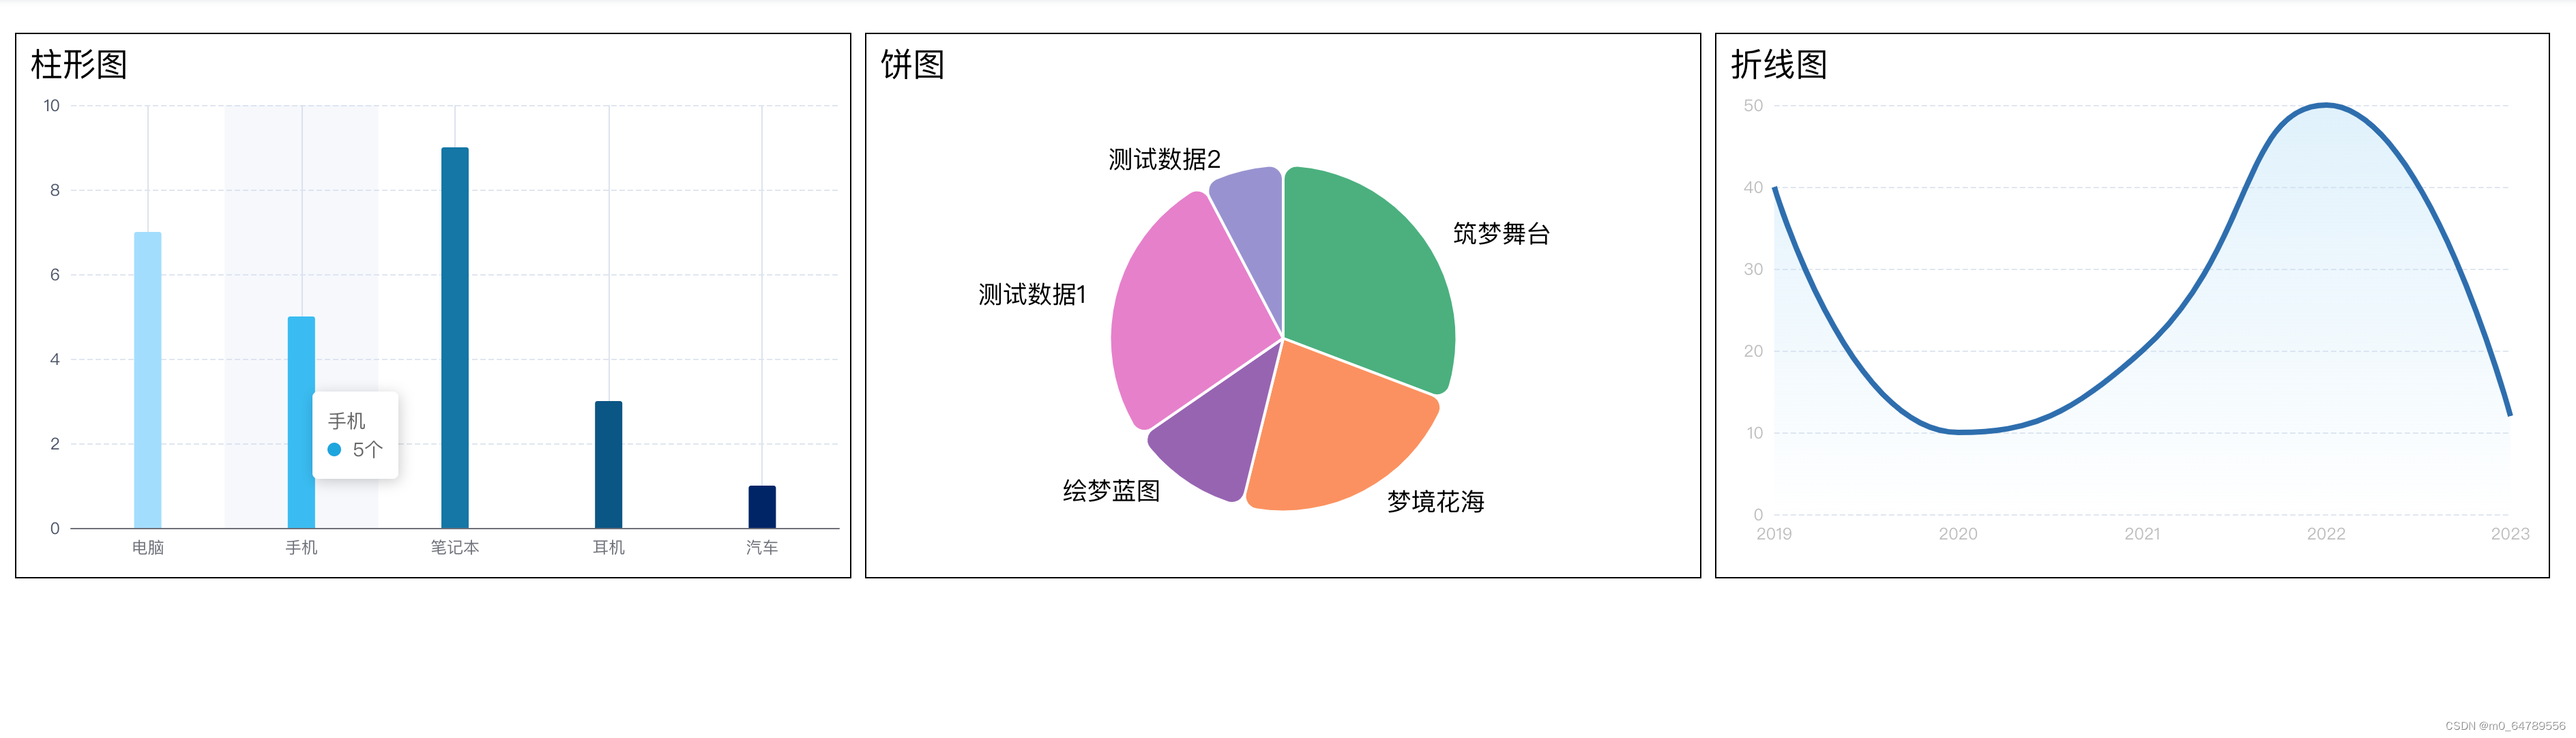
1.组件封装: 柱形图
<template>
  <div class='w100 h100' ref="bar-echart-ref"></div>
</template>

<script>

const echarts = require("echarts");

export default {
  props: {
    showTitle: {
      type: Boolean,
      default: true,
    },
    title: String,
    barLength: {
      type: Number,
      default: 260 ////260'280'
    },
    barWidth: {
      type: Number,
      default: 14
    }
  },
  data() {
    return {
      barEchart: null,

    };
  },
  mounted() {
    window.onresize = () => {
      this.resizeEcharts();
    }
  },
  methods: {
    resizeEcharts() {
      this.barEchart && this.barEchart.resize();
    },
    setOption(info = {}, color) {
      let chartDom = this.$refs['bar-echart-ref'];
      this.barEchart = echarts.init(chartDom);

      let option = {
        title: {
          show: this.showTitle,
          text: this.title,
          left: "center",
          top: "10",
          textStyle: {
            fontSize: 15
          },
        },
        grid: {
          top: "8",
          left: "0",
          right: "8",
          bottom: "0",
          containLabel: true
        },
        tooltip: {
          trigger: 'axis',
          // formatter: (list) => {
          //   const info = list[0];
          //   return `${info.name}<br />${info.marker} ${info.value}${this.unit}`;
          // },
          axisPointer: {
            type: 'shadow'
          },
          formatter: (data) => {
            const params = data[0];

            if(info.max) {
              let marker = `<span style=\"display:inline-block;margin-right:4px;border-radius:2px;border: 1px solid #FFFFFF;width:10px;height:10px;background-color:${params.color};\"></span>`

              return `${params.name}<br />主体数量:${info.numList[params.dataIndex]}<br />${marker}占比:${params.value}%`;
            }

            return `${params.name}<br />${params.marker} ${params.value}`;
          }
        },
        xAxis: {
          type: 'category',
          data: info.xAxis || [],
          axisTick: {
            show: true,
            alignWithLabel: true,
            inside: true,
            length: this.barLength,
            lineStyle: {
              color: '#DDE3EE',
              width: '1'
            }
          },
          gridIndex: 0,
          axisLabel: {
            formatter: val => {
              let txt = val;
              if (val.length > 3) {
                txt = val.substr(0, 3) + '...';
              }

              return txt;
            }
          },
        },
        yAxis: {
          type: 'value',
          splitLine: {
            lineStyle: {
              type: 'dashed'//实线
            },
            show: true //隐藏
          },
          axisLine: {
            lineStyle: {
                color: '#DDE3EE'
            }
          },
          axisLabel: {
            show: true,  // 是否显示,默认true
            color: '#4B5468', // 标签的颜色设置,默认取轴线的颜色
            formatter: (params) => {
              if(info.max) {
                return params + '%';
              }

              return params;
            }
          },
        },
        series: [{
          type: 'bar',
          barWidth: this.barWidth,
          color: color,
          with: this.barWidth,
          data: info.series || [],
          itemStyle: {
            normal: {
                //这里设置柱形图圆角 [左上角,右上角,右下角,左下角]
                barBorderRadius:[2, 2, 0, 0]
            }
          },
        },
      ]
      };

      if(info.title) {
        option.title = info.title;
      }

      if(info.grid) {
        option.grid = info.grid;
      }

      if(info.max) {
        option.yAxis.max = info.max;
        option.yAxis.min = info.min;
        option.yAxis.splitNumber = info.splitNumber;
      }


      this.barEchart.setOption(option);
    },
  },
}
</script>
2.组件封装: 饼图
<template>
  <div class='w100 h100' ref="pie-echart-ref"></div>
</template>

<script>
const echarts = require("echarts");

export default {
  props: {
    showTitle: {
      type: Boolean,
      default: true,
    },
    title: String,
    unit: {
      type: String,
      default: '个',
    },
  },
  data() {
    return {
      pieEchart: null,
      legendData: []
    };
  },
  mounted() {
    window.addEventListener('resize', this.resizeEcharts, true);
  },
  methods: {
    resizeEcharts() {
      this.pieEchart && this.pieEchart.resize();
    },
    setOption(list = [], color, customConfig) {
      let chartDom = this.$refs['pie-echart-ref'];
      this.pieEchart = echarts.init(chartDom);

      let option = {
        title: {
          show: this.showTitle,
          text: this.title,
          left: "center",
          bottom: "0",
          textStyle: {
            fontSize: 16,
            color: '#1D2129'
          },
        },
        color: color || [
          '#5470C6',
          '#9FE080',
          '#FFDC60',
          '#EE6666',
          '#73C0DE',
          '#40B27D',
          '#FF915A',
          '#9A60B4',
          '#EA7CCC',
          '#9991d2',
        ],
        tooltip: {
          trigger: 'item',
          borderWidth: 0,
          formatter: (info) => {
            info.marker = info.marker.replace('border-radius:10px', 'border-radius:2px;border: 1px solid #FFFFFF');
            return `${info.name}<br />${info.marker} ${info.value}${this.unit}`;
          },
          // backgroundColor: '#5470C6',
          textStyle: {
            fontSize: '14px',
            // color: '#fff'
          }
        },
        legend: {
          icon: 'circle',
          // type: 'scroll',
          align: 'auto',
          orient: 'horizontal',
          itemHeight: 12,
          bottom: 80,
          itemGap: 24,
          textStyle: {
            fontSize: 14,
            color: '#6E7B91',
            lineHeight: 14
          },
          data: this.legendData
        },
        series: [{
          type: 'pie',
          top: '20px',
          radius: '80%',
          // radius: ['40%', '52%'],
          // center: ['50%', '36%'],
          // avoidLabelOverlap: false,
          itemStyle: {
            borderRadius: 10,
            borderColor: '#fff',
            borderWidth: 2
          },
          label: {
            color: '#000',
            lineHeight: 20,
            fontSize: 18,
          },
          emphasis: {
            label: {
              show: true,
              fontSize: '40',
              fontWeight: 'bold'
            },
            itemStyle: {
              // 改变阴影大小
              shadowBlur: 0,
              shadowOffsetX: 0,
            }
          },
          labelLine: {
            show: false,
            length: 8,
            length2: 8
          },
          data: list || [],
          hoverAnimation: false,
        }]
      };

      this.pieEchart.setOption(option);
    },
  },
}
</script>
3.组件封装: 折线图
<template>
  <div class='w100 h100' ref="line-echart-ref"></div>
</template>

<script>
const echarts = require("echarts");

export default {
  props: {
    showTitle: {
      type: Boolean,
      default: true,
    },
    title: String,
    unit: {
      type: String,
      default: '',
    },
  },
  data() {
    return {
      lineEchart: null,

    };
  },
  mounted() {
    window.addEventListener('resize', this.resizeEcharts, true);
  },
  methods: {
    resizeEcharts() {
      this.lineEchart && this.lineEchart.resize();
    },
    setOption(info = {}, yAxisCustom, seriesCustom, areaStyle) {
      let chartDom = this.$refs['line-echart-ref'];
      this.lineEchart = echarts.init(chartDom);

      let option = {
        title: {
          show: this.showTitle,
          text: this.title,
          left: "center",
          // top: "10",
          bottom: '0',
          textStyle: {
            fontSize: 16,
            color: '#1D2129'
          },
        },
        grid: {
          top: "8",
          left: "20",
          right: "28",
          bottom: "10",
          containLabel: true
        },
        tooltip: {
          trigger: 'axis',
          axisPointer: {            // 坐标轴指示器,坐标轴触发有效
            type: 'line',        // 默认为直线,可选为:'line' | 'shadow'
          },
          formatter: (list) => {
            const info = list[0];
            // console.log(list);
            // return `${info.name}<br />${info.marker}  ${info.seriesName} ${info.value}${this.unit}`;


            list.forEach(item => {
              item.marker = item.marker.replace('border-radius:10px', 'border-radius:2px;border: 1px solid #FFFFFF');
            })
            let showStr = '';
            if (list.length == 1) {
              showStr = `${info.name}<br />${info.marker}  ${info.seriesName} ${info.value}${this.unit}`;
            } else {
              showStr = `${info.name}<br />${info.marker}  ${info.seriesName} ${info.value}${this.unit}<br />${list[1].marker}  ${list[1].seriesName} ${list[1].value}${this.unit}`;
            }

            return showStr;
          }
        },
        visualMap: {
          show: false,
          dimension: 0,
          inRange: {
            symbolSize: [12, 12]
          },
        },
        xAxis: {
          type: 'category',
          data: info.xAxis || [],
          axisTick: {
            show: false,
          },
          axisLabel: {
            show: true,
            color: '#BEBEBE', // 标签的颜色设置,默认取轴线的颜色
          },
          axisTick: {
            show: false,
          },
          axisLine: {
            show: false
          },
          splitLine: {
            lineStyle: {
              type: 'solid'
            },
            show: false //隐藏
          },
          boundaryGap: false,// 不留白,从原点开始
        },
        yAxis: {
          type: 'value',
          ...yAxisCustom,
          splitLine: {
            lineStyle: {
              type: 'dashed',
              // color: '#F6F6F6'
            },
            show: true
          },
          axisLabel: {
            show: true,  // 是否显示,默认true
            color: '#BEBEBE', // 标签的颜色设置,默认取轴线的颜色
          },
          axisLine: {
            lineStyle: {
              color: '#DDE3EE'
            }
          }
        },
        series: [
          {
            data: info.series || [],
            type: 'line',
            // symbol: 'none',
            smooth: true,
            symbol: 'circle',
            showSymbol: false,
            lineStyle: {
              width: 4, //设置线宽为0
            },
            areaStyle: areaStyle,
            itemStyle: {
              borderWidth: 4,
              borderColor: '#FFF',
            },
            ...seriesCustom,
          }
        ]
      };

      this.lineEchart.setOption(option);
    },
  },
}
</script>
组件的使用
<template>
  <div class='demo w100 h100'>
    <div class="grid-box">
      <div>
        <header class="header">柱形图/bar</header>
        <!-- 柱形图 -->
        <div class="w100 line-charts">
          <bar-echart-comp ref="barEchartCompRef" :barLength="310" />
        </div>
      </div>
      <div>
        <header class="header">饼图/pie</header>
        <!-- 饼图 -->
        <div class="w100 line-charts">
          <pie-echart-comp ref="pieEchartCompRef" />
        </div>
      </div>
      <div>
        <header class="header">折线图</header>
        <!-- 柱形图 -->
        <div class="w100 line-charts">
          <line-echart-comp ref="lineEchartCompRef" :bar-width="16" :barLength="280" />
        </div>
      </div>
    </div>
  </div>
</template>

<script>
const echarts = require("echarts");
import BarEchartComp from "./components/echarts/bar-echart-comp.vue";
import PieEchartComp from './components/echarts/pie-echart-comp.vue';
import LineEchartComp from './components/echarts/line-echart-comp.vue';
export default {
  components: {
    BarEchartComp,
    PieEchartComp,
    LineEchartComp
  },
  data() {
    return {
      barEchartData: {
        xAxis: ['电脑', '手机', '笔记本', '耳机', '汽车'],
        series: [
          {
            value: 7,
            itemStyle: {
              color: '#A0DCFF'
            }
          },
          {
            value: 5,
            itemStyle: {
              color: '#00A3E0'
            }
          },
          {
            value: 9,
            itemStyle: {
              color: '#0076A8'
            }
          },
          {
            value: 3,
            itemStyle: {
              color: '#005587'
            }
          },
          {
            value: 1,
            itemStyle: {
              color: '#012169'
            }
          },
        ],
      },
      pieEchartData: [
        { value: 800, name: '筑梦舞台' },
        { value: 600, name: '梦境花海' },
        { value: 300, name: '绘梦蓝图' },
        { value: 700, name: '测试数据1' },
        { value: 200, name: '测试数据2' }
      ],
      lineData: {
        xAxis: [],
        series: []
      }
    };
  },
  mounted() {
    this.configData();
  },
  methods: {
    configData() {
      this.reqBarEchartsData();
      this.pieBarEchartsData();
      this.linEchartsData();
    },
    reqBarEchartsData() {
      let color = [
        '#A0DCFF',
        '#00A3E0',
        '#0076A8',
        '#005587',
        '#012169',
      ];
      this.$refs.barEchartCompRef.setOption(this.barEchartData, color);
    },
    pieBarEchartsData() {
      let color = [
        '#40B27D',
        '#FF915A',
        '#9A60B4',
        '#EA7CCC',
        '#9991d2',
      ];
      this.$refs.pieEchartCompRef.setOption(this.pieEchartData, color);
    },
    linEchartsData() {
      let yAxisCustom = {
        // max: 60,
        // min: 0,
        // splitNumber: 6,
      };

      let seriesCustom = {
        color: '#2B6CB0',
        name: '',
      };

      let areaStyle = {
        color: new echarts.graphic.LinearGradient(0, 0, 0, 1, [
          {
            offset: 0,
            color: 'rgba(190, 227, 248, 0.7)'
          },
          {
            offset: 1,
            color: 'rgba(190, 227, 248, 0)'
          }
        ])
      };

      const data = [{ "time": "2019", "num": 40 }, { "time": "2020", "num": 10 }, { "time": "2021", "num": 20 }, { "time": "2022", "num": 50 }, { "time": "2023", "num": 12 }];

      data.forEach(item => {
        this.lineData.xAxis.push(item.time);
        this.lineData.series.push(item.num);
      })
      this.$refs.lineEchartCompRef.setOption(this.lineData, yAxisCustom, seriesCustom, areaStyle);
    }
  },
}
</script>
<style lang='scss' scoped>
.demo {
  padding: 24px;

  .grid-box {
    height: 400px;
    display: flex;
    margin-right: -10px;

    .header {
      margin: 10px;

    }

    >div {
      border: 1px solid;
      width: calc(100%/3);
      margin-right: 10px;
    }
  }
}

.line-charts {
  height: calc(100% - 60px);
}
</style>
参考文档:

欢迎加入 MCP 技术社区!与志同道合者携手前行,一同解锁 MCP 技术的无限可能!
更多推荐
 1
1 0
0- 0


 已为社区贡献1条内容

所有评论(0)