pyside2|PYQT5 采用matplotlib实时绘图界面卡死、无响应
程序目的:实时检测传感器数据,调用云端模型给出预测结果,并做实时数据绘图。问题:程序长时间运行后,云端模型能够实时给出预测结果,但是绘图窗口卡顿,最终界面卡死以下是 原程序 绘图部分代码:def plot_and_show(self):global obsXglobal obsYglobal diagnosis_resultglobal jself.textEdit.append(f'{diagn
·
程序目的:实时检测传感器数据,调用云端模型给出预测结果,并做实时数据绘图。
问题:程序长时间运行后,云端模型能够实时给出预测结果,但是绘图窗口卡顿,最终界面卡死
以下是 原程序 绘图部分代码:
    def plot_and_show(self):
        global obsX
        global obsY
        global diagnosis_result
        global j
        self.textEdit.append(f'{diagnosis_result}')
        self.textEdit.ensureCursorVisible()

        plot_x = np.concatenate((obsX))[0:500:10]
        plot_y = np.concatenate((obsY), axis=1)[:,0:500:10] # 绘图数据

        ax = self.figure1.add_subplot(211)

        ax.plot(plot_x, plot_y[0, :]/500, '-r', marker='*')
        ax.plot(plot_x, plot_y[1, :]/500, '-g', marker='*')
        ax.plot(plot_x, plot_y[2, :]/500, '-y', marker='*')
        ax.plot(plot_x, plot_y[3, :]/500, '-k', marker='*')
        ax.set_xlim([j-3,j+1])
        ax.set_ylim([-5,5])

        plt.legend(labels = ['速度1', '速度2', '速度3', '速度4'], loc = 'best', prop= {'family':'SimHei', 'weight':'normal'})

        ax1 = self.figure1.add_subplot(212)
        ax1.plot(plot_x, plot_y[8, :], '-r',marker='*')
        ax1.plot(plot_x, plot_y[9, :], '-g',marker='*')
        ax1.plot(plot_x, plot_y[10, :], '-y',marker='*')
        ax1.plot(plot_x, plot_y[11, :], '-k',marker='*')
        plt.legend(labels = ['力矩1', '力矩2', '力矩3', '力矩4'], loc = 'best', prop= {'family':'SimHei', 'weight':'normal'})
        ax1.set_xlim([j-3,j+1])
        ax1.set_ylim([-2,2])

        self.canvas1.draw()
绘图效果:
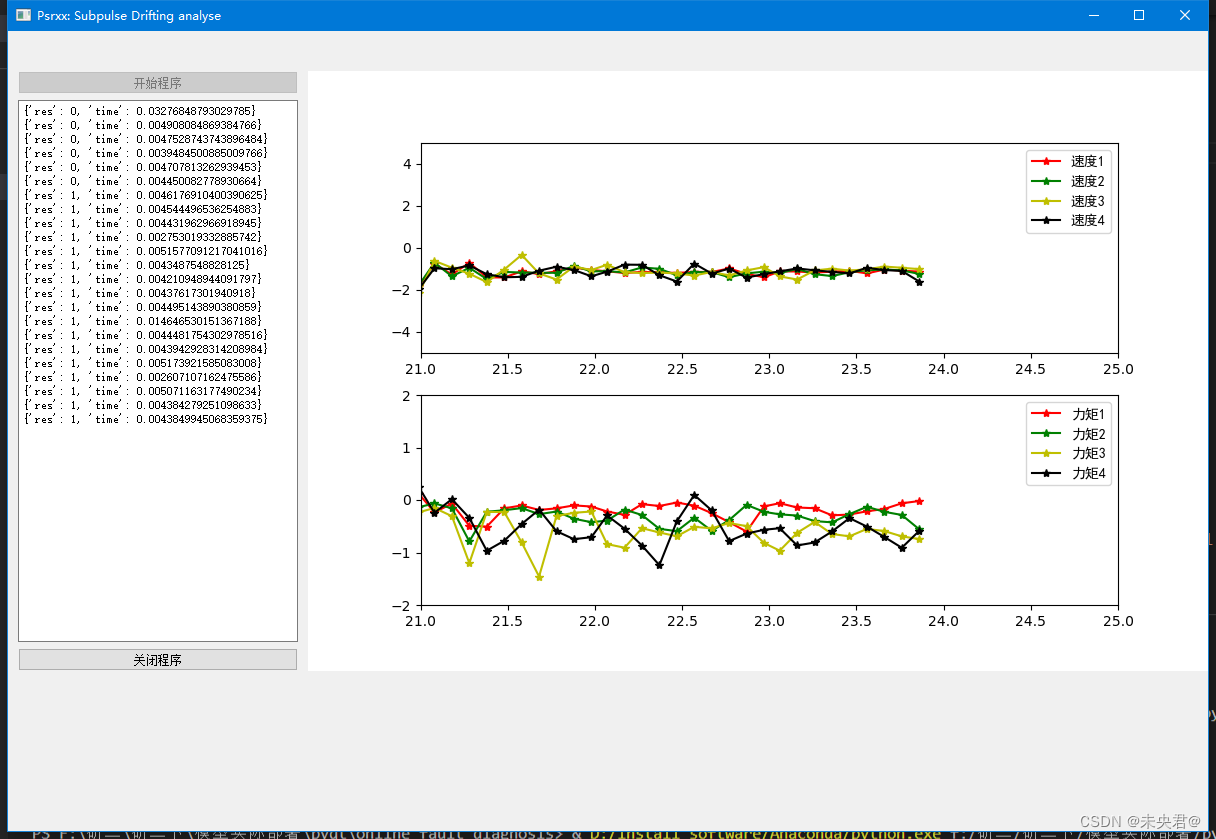
寻找问题过程中,删除 set_xlim() 和 set_ylim()代码后,绘图结果如图:
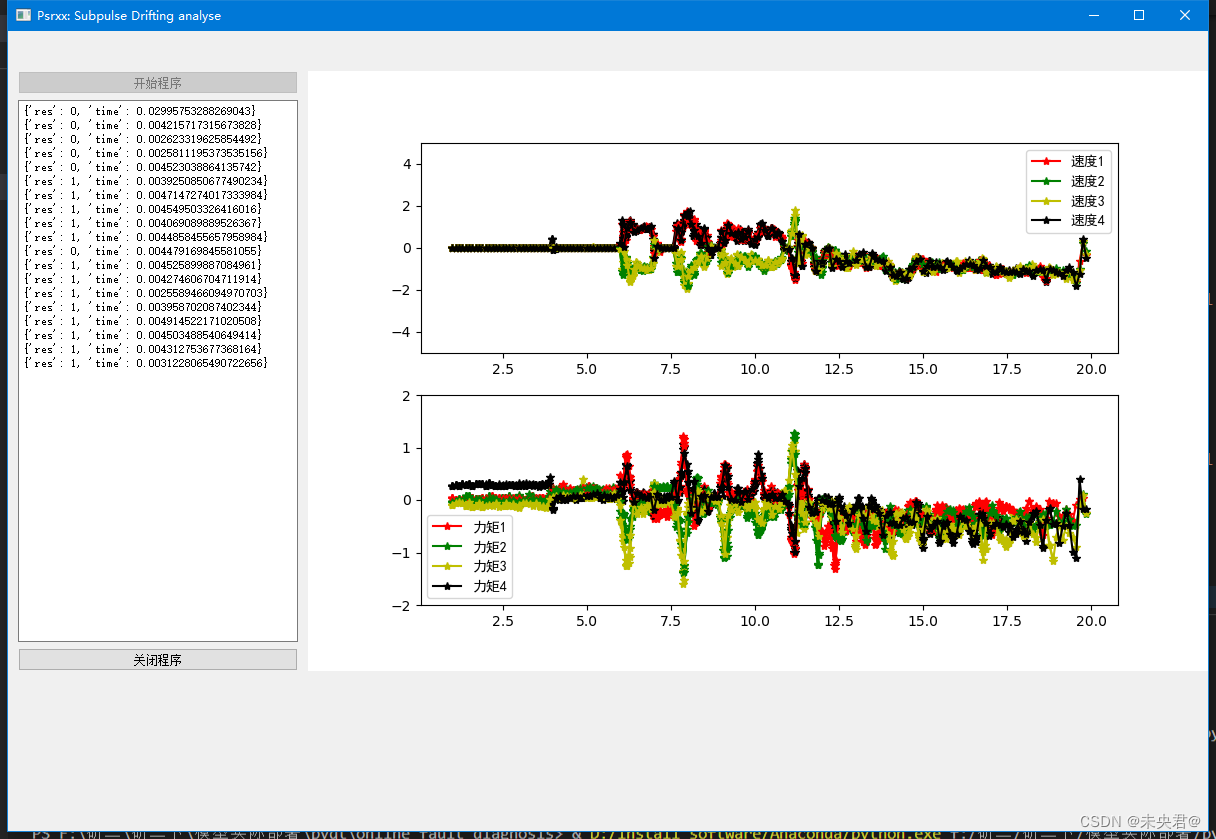
可以看到 历史绘图 全部保存在画布中,长时间运行后,缓存数据太多,导致程序的卡死
问题解决方法:
在绘图程序前,加入代码: plt.clf() 清空画布,问题解决
 def plot_and_show(self):
        global obsX
        global obsY
        global diagnosis_result
        global j
        self.textEdit.append(f'{diagnosis_result}')
        self.textEdit.ensureCursorVisible()

        plot_x = np.concatenate((obsX))[0:500:10]
        plot_y = np.concatenate((obsY), axis=1)[:,0:500:10] # 绘图数据

        plt.clf()

        ax = self.figure1.add_subplot(211)

        ax.plot(plot_x, plot_y[0, :]/500, '-r', marker='*')
        ax.plot(plot_x, plot_y[1, :]/500, '-g', marker='*')
        ax.plot(plot_x, plot_y[2, :]/500, '-y', marker='*')
        ax.plot(plot_x, plot_y[3, :]/500, '-k', marker='*')
        ax.set_xlim([j-3,j+1])
        ax.set_ylim([-5,5])

        plt.legend(labels = ['速度1', '速度2', '速度3', '速度4'], loc = 'best', prop= {'family':'SimHei', 'weight':'normal'})

        ax1 = self.figure1.add_subplot(212)
        ax1.plot(plot_x, plot_y[8, :], '-r',marker='*')
        ax1.plot(plot_x, plot_y[9, :], '-g',marker='*')
        ax1.plot(plot_x, plot_y[10, :], '-y',marker='*')
        ax1.plot(plot_x, plot_y[11, :], '-k',marker='*')
        plt.legend(labels = ['力矩1', '力矩2', '力矩3', '力矩4'], loc = 'best', prop= {'family':'SimHei', 'weight':'normal'})
        ax1.set_xlim([j-3,j+1])
        ax1.set_ylim([-2,2])

self.canvas1.draw()注:
import matplotlib.pyplot as plt

plt.clf() # 清图。
plt.cla() # 清坐标轴。
plt.close() # 关窗口
欢迎加入 MCP 技术社区!与志同道合者携手前行,一同解锁 MCP 技术的无限可能!
更多推荐


 5
5 0
0- 0


 已为社区贡献1条内容

所有评论(0)