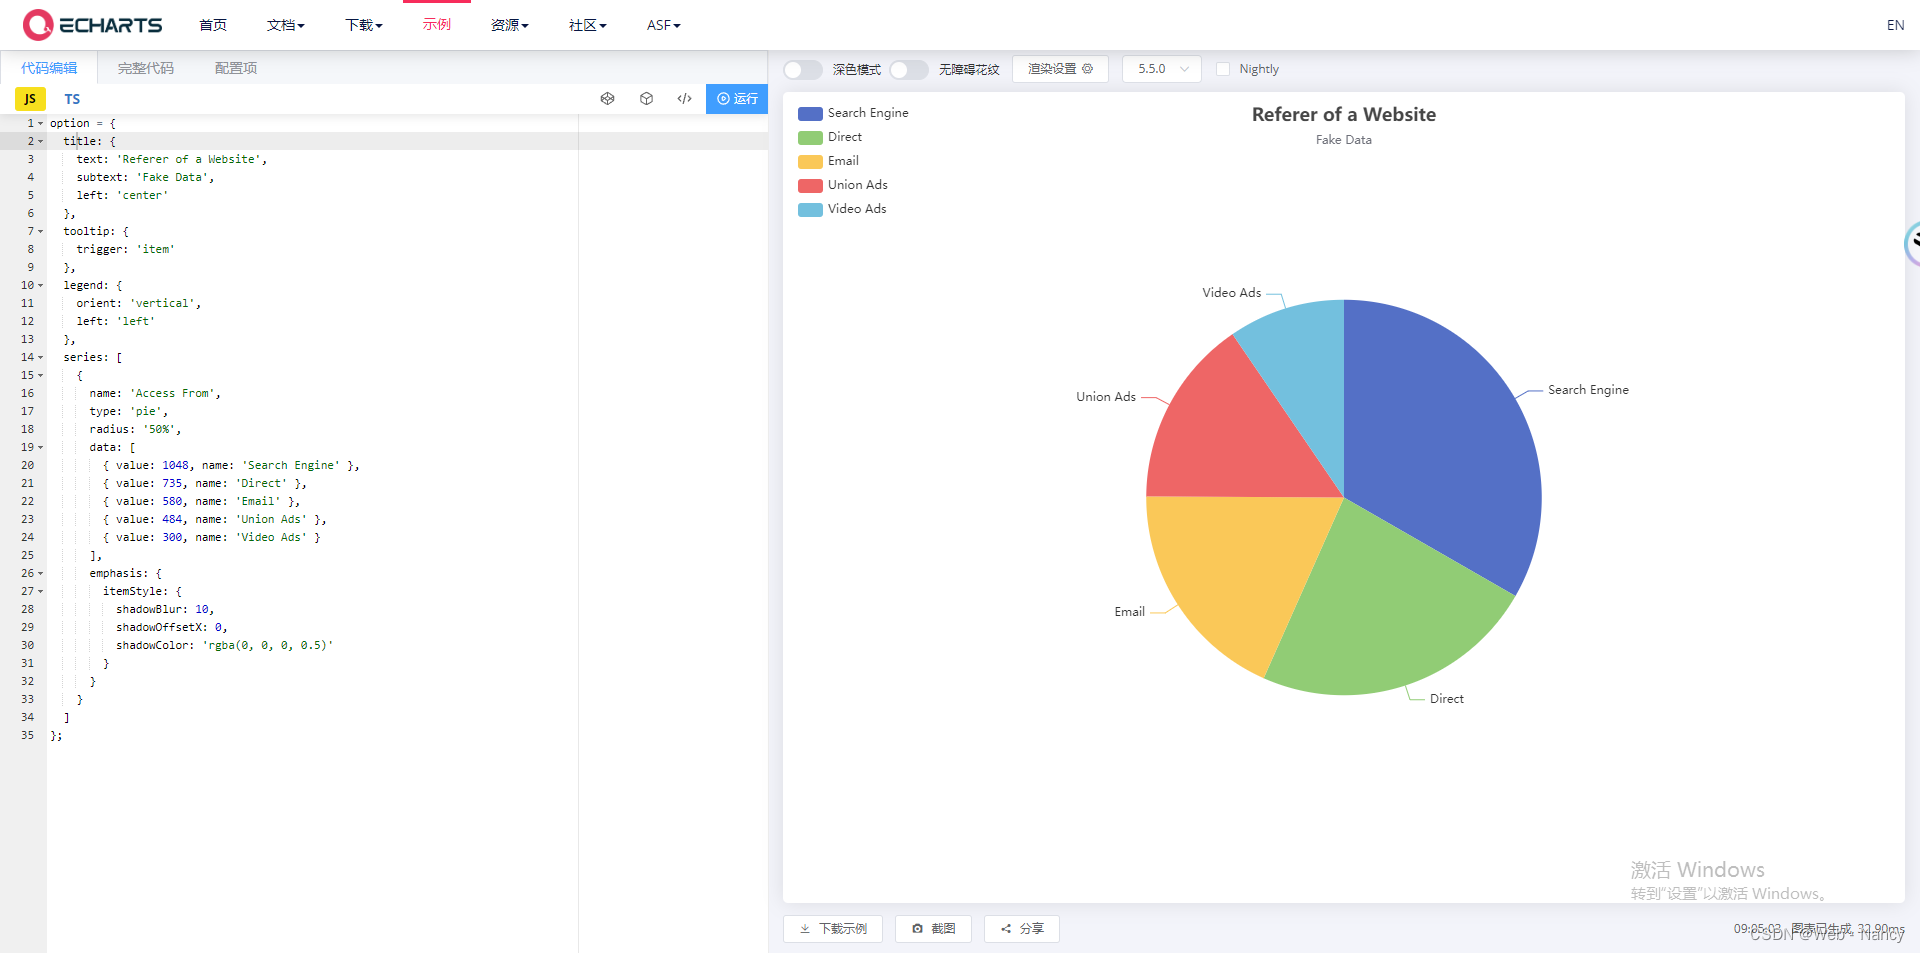
Vue3 封装ECharts 组件 抽离复用 包含图表随着窗口宽高变化而变化 - 附完整示例
避免重复的代码造成冗余,抽离封装提高复用性代码逻辑更加清晰,方便后期维护Apache EChartsApache ECharts,一款基于JavaScript的数据可视化图表库,提供直观,生动,可交互,可个性化定制的数据可视化图表。
·
ECharts:一个基于 JavaScript 的开源可视化图表库。
目录
3、数据处理(关键点) - 部分代码已省略,可看文末的完整示例
前言
1、目的
- 避免重复的代码造成冗余,抽离封装提高复用性
- 代码逻辑更加清晰,方便后期维护
2、功能
- 可灵活使用组件传递 option
- 图表自适应宽高
- 可动态获取后端数据
一、介绍
1、官方文档:Apache ECharts
2、官方示例
二、准备工作
1、安装依赖包
npm install echarts --save2、示例版本
"echarts": "^5.4.2",三、使用步骤
1、在单页面引入 ' echarts '
import * as echarts from "echarts";注:上面的代码会引入 ECharts 中所有的图表和组件,如果你不想引入所有组件,也可以使用 ECharts 提供的按需引入的接口来打包必须的组件。详见官方文档:在项目中引入 ECharts - 入门篇 - Handbook - Apache ECharts
2、指定容器并设置容器宽高
<template>
	<div class="wrap">
	</div>
</template>


<style lang="scss" scoped>
.wrap {
	width: 800px;
	height: 600px;
	overflow: hidden;
}
</style>
3、数据处理(关键点) - 部分代码已省略,可看文末的完整示例
1)使用markRaw
const initChart = () => {
	// 初始化echart
	myChart.value = markRaw(echarts.init(document.getElementById(props.id) as HTMLDivElement));

	// 设置true清空echart缓存
	myChart.value.setOption(props.options, true);
};
注:ECharts会被在Vue内部转换成响应式对象,从而在resize 的时候获取不到
使用 Vue的API , markRaw,标记一个对象,使其不能成为一个响应式对象
2)使用 ResizeObserver + resize
// 页面挂载,开始绘制图表
onMounted(() => {
	nextTick(() => {
		initChart();
		resizeEle.value = new ResizeObserver((entries) => {
			for (let entry of entries) {
				const { width, height } = entry.contentRect;
				myChart.value.resize({ width, height });
			}
		});

		// 传入需要监听的DOM元素
		resizeEle.value.observe(chartRef.value);
		window.addEventListener('resize', resize);
	});
});
注:ResizeObserver / resize / element-resize-detector的详细文章 =》CSDN
四、完整示例
ECharts.vue
<template>
	<div :id="id" :class="className" ref="chartRef" :style="{ width, height }" />
</template>
<script setup lang="ts">
import * as echarts from 'echarts';
import { ref, defineProps, watch, onMounted, onUnmounted } from 'vue';
const myChart = ref();
const timerTooltip = ref();
const resizeEle = ref();
const drawTiming = ref();
const chartRef = ref();

const props = defineProps({
	options: {
		type: Object,
		default: () => ({}),
		required: true,
	},
	trendsTooltip: {
		type: Boolean,
		default: false,
	},
	id: {
		type: String,
		default: 'chart',
		required: true,
	},
	className: {
		type: String,
		default: 'chart',
	},
	width: {
		type: String,
		default: '100%',
	},
	height: {
		type: String,
		default: '300px',
	},
});

const resize = () => {
	clearTimeout(drawTiming.value);
	drawTiming.value = setTimeout(() => {
		let { clientWidth: width, clientHeight: height } = chartRef.value.parentElement;
		myChart.value.resize({ width, height });
	}, 200);
};

const initChart = () => {
	// 初始化echart
	myChart.value = markRaw(echarts.init(document.getElementById(props.id) as HTMLDivElement));

	// 设置true清空echart缓存
	myChart.value.setOption(props.options, true);
};

// 页面挂载,开始绘制图表
onMounted(() => {
	nextTick(() => {
		initChart();
		resizeEle.value = new ResizeObserver((entries) => {
			for (let entry of entries) {
				const { width, height } = entry.contentRect;
				myChart.value.resize({ width, height });
			}
		});

		// 传入需要监听的DOM元素
		resizeEle.value.observe(chartRef.value);
		window.addEventListener('resize', resize);
	});
});

// 页面卸载,销毁事件和实例
onUnmounted(() => {
	// 取消对所有节点的监听
	resizeEle.value.disconnect(chartRef.value);
	window.removeEventListener('resize', resize);

	myChart.value.dispose();
	myChart.value = null;
	clearTimeout(drawTiming.value);
	drawTiming.value = null;
});

// 监听图表数据时候变化,重新渲染图表
watch(
	() => props.options,
	() => {
		nextTick(() => {
			initChart();
		});
		// }
	},
	{ deep: true }
);
</script>
Example.vue
<template>
	<Echarts :options="options" :trendsTooltip="trendsTooltip" :id="'chart' + Math.random()" width="100%" height="100%" />
</template>

<script setup lang="ts">
import Echarts from './ECharts.vue';
import { ref, defineProps, watch } from 'vue';

const options = ref();

const props = defineProps({
	cdata: {
		type: Array,
		default: () => [],
	},
	trendsTooltip: {
		type: Boolean,
		default: false,
	},
	width: {
		type: String,
		default: '100%',
	},
	height: {
		type: String,
		default: '300px',
	},
});

watch(
	() => props.cdata,
	(newVal, oldValue) => {
		if (newVal.length === 0) return;
		options.value = {
			tooltip: {
				trigger: 'item',
				confine: true,
			},
			grid: {
				top: 10,
				bottom: 10,
				left: 10,
				right: 10,
				containLabel: true,
			},
			legend: false,
			series: [
				{
					type: 'pie',
					radius: '50%',
					data: newVal,
					emphasis: {
						itemStyle: {
							shadowBlur: 10,
							shadowOffsetX: 0,
							shadowColor: 'rgba(0, 0, 0, 0.5)',
						},
					},
				},
			],
		};
	},
	{ deep: true, immediate: true }
);
</script>
Index.vue
<template>
	<div class="wrap">
        <Example
			id="leftMiddleChart"
			:cdata="[
			{ value: 1048, name: '未开工' },
			{ value: 735, name: '进行中' },
			{ value: 580, name: '已完工' },
			]"
			:trendsTooltip="true"
		/>
	</div>
</template>

<script setup lang="ts">
import { defineAsyncComponent } from 'vue';

// 引入组件
const Example= defineAsyncComponent(() => import('./Example.vue'));

</script>

<style lang="scss" scoped>
.wrap {
	width: 800px;
	height: 600px;
	overflow: hidden;
}
</style>
欢迎扫描下方二维码关注VX公众号


欢迎加入 MCP 技术社区!与志同道合者携手前行,一同解锁 MCP 技术的无限可能!
更多推荐

 11
11 0
0- 0


 已为社区贡献2条内容

所有评论(0)