上下文 AI:停止探测 SRE:三个 MCP 工具让 Elastic Agent Builder 成为你们团队的运维手册
作者:来自 Elastic Jeffrey Rengifo
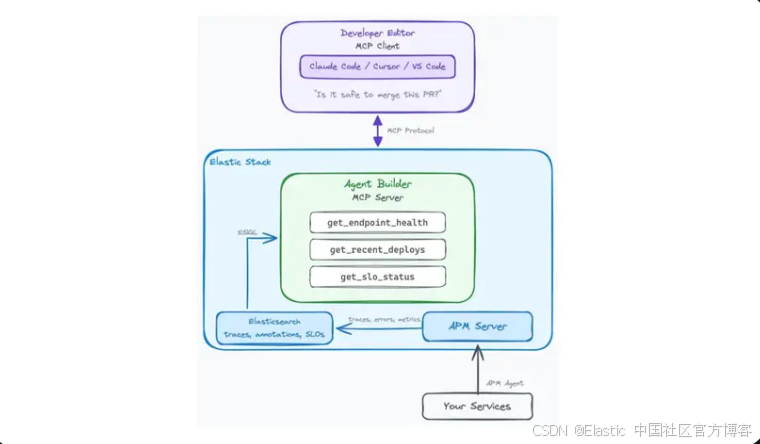
在 Elastic Agent Builder 中构建三个 MCP tools,这些 tools 可以在你的 editor 中直接读取 endpoint health、recent deploys 以及 SLO burn rate。将你们 platform team 的 runbook 编码一次;每个 developer 都可以自助获取 production context,而无需 ping SRE。
一个开发者在他的编辑器中问:“Is it safe to merge this PR?”,几秒钟内就能得到真实答案,而不是花10–15分钟去查 dashboard 或在 Slack 里 ping 一个 SRE。本文展示如何在 Elastic Agent Builder 中构建三个 MCP tools,这些 tools 用来直接读取 endpoint health、recent deploys 和 SLO burn rate,并将 platform team 的解释规则、error rate 阈值、deploy warm-up windows 以及 burn rate limits 直接编码到 tool descriptions 中。最终结果是 contextual AI:一个 agent,它使用 platform team 一次性编写的 runbook 来对 production signals 进行推理。
Elastic Agent Builder MCP tools 的前置条件
-
一个 Elastic Cloud 部署,运行 Elastic Stack 9.3+(或 Elastic Cloud Serverless),并已启用 Agent Builder。
-
一个已接入 APM 的 service。如果你的 cluster 还没有 APM data,配套 notebook 包含使用 elastic/apm-integration-testing 通过
opbeans-nodedemo app生成 synthetic traffic 的说明。 -
一个支持 MCP 的 client: Claude Code、 Cursor,或带 MCP extension 的 VS Code。
-
对 ES|QL 语法的基础了解 ES|QL。
-
Node.js 18+(用于
bridge)。
如果你是 MCP 新手,或者需要首次配置 Elastic MCP server,可以查看 Elastic MCP 服务器:向任何 AI agent 暴露 Agent Builder 工具 获取完整 setup walkthrough。本文假设 MCP server 已经配置完成。
问题:为什么开发者在“盲飞”
一个开发者即将合并一个 pull request。这个改动看起来很简单:把下游 recommendations service 调用的超时时间从 2 秒增加到 5 秒。但在点击 merge 按钮之前,一个问题挥之不去:现在这个 service 是否足够健康,能够承受这个变更?
要回答这个问题,开发者今天有两个选择:
-
手动检查 dashboards。 打开 APM UI,查看 error rates,扫描 latency charts,找到 SLO page,并查看最近 deploys。这需要10到15分钟,并且要求知道要看什么以及如何解释。
-
询问 SRE。 在 Slack 上 ping platform team:“嘿,checkout 现在健康吗?我想合并一个改动。” 这会造成打扰,增加决策延迟,并且无法扩展。
核心问题不在于数据。Elastic 已经收集了所有内容:traces、metrics、error logs、deploy markers 和 SLO budgets。问题在于关联多个 signals 需要认知开销以及大多数开发者不具备的领域知识。
一个 SRE 知道,在 deploy 之后的 p99 spike 在5分钟内是正常的,error rate 低于0.5%在 release window 内是可接受的,并且在 SLO budget 低于20%时进行 merge 是有风险的。这些知识存在于 runbooks、经验以及集体记忆中。
如果 platform engineer 可以把这些知识编码进 tools,让任何开发者都能在 editor 中直接查询,会怎样?
Elastic Agent Builder 中的 MCP tools 如何编码你的 runbook
关键洞察是:tool 不只是一个 query;它是 query 加上 interpretation。dashboard 会展示 p99 为450ms,而一个设计良好的 tool 会告诉你:“p99 为 450ms,在该 service 的正常范围内,并且自从 2 小时前的 last deploy 以来一直保持稳定。”
区别在于 tool description 承载了 domain knowledge。当 platform engineer 在 Agent Builder 中创建 tool 时,他们会写类似这样的 description:“Error rate 超过1%通常表示 regression。如果它与 recent deploy 同时发生,那么 deploy 很可能是原因。”这个 description 会成为 AI agent 在跨多个 tool results 推理时使用的 context 的一部分。
这就是我们所说的 contextual AI:AI agent 不只是获取 data;它是使用 platform team 编码的 interpretation rules 来对其进行推理。
架构如下:
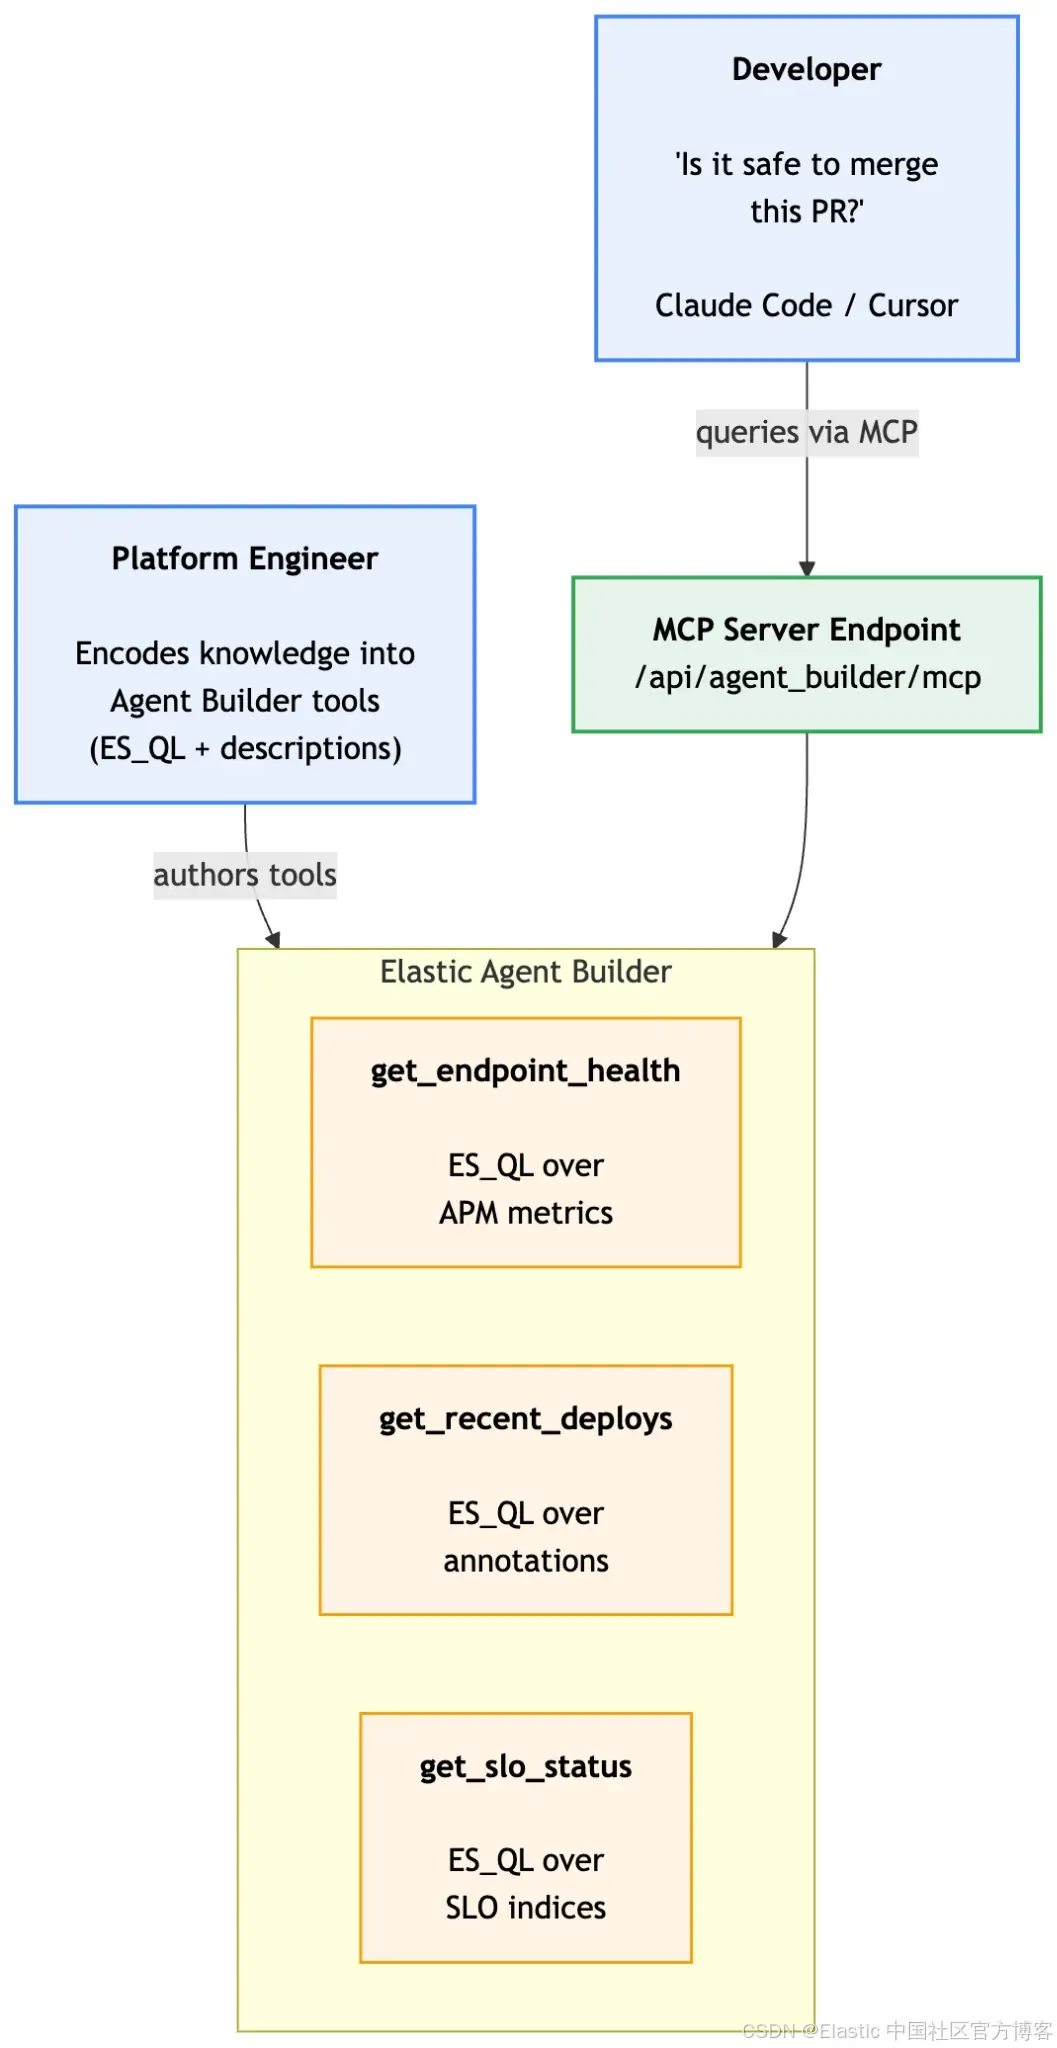
平台工程师一次性编写这些 tools。团队中每个开发者都可以在自己的 editor 中受益,而不需要学习 ES|QL 或理解 APM data models。
设置 Elastic Agent Builder 示例环境
完整的端到端设置(使用 opbeans-node 进行 traffic generation、deploy annotations、SLO creation,以及三个 Agent Builder tools)可以在这个 repository 中的可运行 notebook 获取:Contextual AI Notebook。下面的部分重点关注 ES|QL queries 和 tool descriptions:每个 tool 背后的 why,而不是如何执行它们的机制。
构建 Tool 1:get_endpoint_health
这个 tool 用来回答问题:“这个 endpoint 现在表现如何?” 它会在指定的 time window 内返回 service 和 endpoint 的 error rate、latency percentiles(p50、p95、p99)以及 throughput。
以下是在 Elastic Agent Builder 中创建的完整 tool configuration:ES|QL Tools Documentation
{
  "id": "get_endpoint_health",
  "type": "esql",
  "description": "Returns the current health of a service endpoint: error rate, latency percentiles (p50/p95/p99), and throughput. Use this tool to assess whether a service is healthy before making changes. Interpretation guide: error rate below 0.5% is healthy, 0.5-1% is elevated (check for recent deploys), above 1% indicates a problem. For latency, compare p99 against the service baseline: checkout is typically under 500ms, product-search under 200ms. A sudden p99 spike within 15 minutes of a deploy suggests the deploy caused a regression.",
  "tags": ["apm", "reliability", "health"],
  "configuration": {
    "query": "FROM traces-apm-* | WHERE service.name == ?serviceName AND @timestamp >= NOW() - ?timeWindow AND transaction.duration.us IS NOT NULL | STATS total_transactions = COUNT(*), error_count = SUM(CASE(event.outcome == \"failure\", 1, 0)), p50_latency_ms = PERCENTILE(transaction.duration.us, 50) / 1000, p95_latency_ms = PERCENTILE(transaction.duration.us, 95) / 1000, p99_latency_ms = PERCENTILE(transaction.duration.us, 99) / 1000 BY service.name | EVAL error_rate_pct = ROUND(error_count / total_transactions * 100, 2) | EVAL throughput_per_min = ROUND(total_transactions / ?windowMinutes, 1)",
    "params": {
      "serviceName": {
        "type": "keyword",
        "description": "The APM service name to check (e.g., opbeans-node)"
      },
      "timeWindow": {
        "type": "keyword",
        "description": "Time window to analyze, in ES|QL duration format (e.g., 30 minutes, 1 hour, 6 hours)"
      },
      "windowMinutes": {
        "type": "integer",
        "description": "Time window in minutes, used to calculate throughput per minute"
      }
    }
  }
}
该 query 使用了 Elastic APM traces data stream,它包含原始 transaction data。我们通过 filter transaction.duration.us IS NOT NULL 来只选择 transaction events(排除 spans)。使用 traces-apm-* 比使用预聚合的(pre-aggregated)的 metrics-apm.transaction.1m-* data stream 更具可移植性,因为后者只有在持续 traffic 之后才会被填充。
注意 description field。它不仅仅是 “返回 health metrics”。它还包含interpretation rules:error rate 的阈值意味着什么,latency baseline 是什么样的,以及如何将 spikes 与 deploy 进行关联。这就是被编码进 tool 的 runbook。
构建 Tool 2:get_recent_deploys
这个 tool 用来回答:“最近部署了什么?”deploy history 是一个关键 context,因为大多数 production issues 都与 code changes 有关。agent 需要它来判断当前 metrics 是正常波动,还是 recent deployment 的影响。
deploy annotations 存储在 observability-annotations index 中。以下是完整 tool configuration:
{
  "id": "get_recent_deploys",
  "type": "esql",
  "description": "Returns the deployment history for a service over the last 24 hours, including version numbers, timestamps, and deploy messages. Use this tool to understand the deployment timeline when assessing service health. Key patterns: if a deploy happened within the last 15 minutes, elevated error rates or latency may be expected (warm-up period). If metrics degraded immediately after a deploy, the deploy is the likely cause. Multiple deploys in a short window (under 2 hours) increase risk because it becomes harder to isolate which change caused an issue.",
  "tags": ["apm", "deploys", "change-tracking"],
  "configuration": {
    "query": "FROM observability-annotations | WHERE service.name == ?serviceName AND @timestamp >= NOW() - 24 hours | SORT @timestamp DESC | KEEP @timestamp, service.version, service.environment, message | LIMIT 10",
    "params": {
      "serviceName": {
        "type": "keyword",
        "description": "The APM service name to check deploy history for"
      }
    }
  }
}
同样地,description 这个字段编码了 domain knowledge:15分钟的 warm-up window、deploy 与 metric 变化之间的 correlation,以及 multiple rapid deploys 的风险。这就是 platform engineer 将他们的 intuition 转移为 AI agent 可以进行 reasoning 的方式。
构建 Tool 3:get_slo_status
这个 tool 用来回答:“我们还剩多少 error budget?” SLO budget 是 platform team 用来表达 risk tolerance 的量化方式。如果 budget 几乎用尽,那么即使很小的 change 也可能导致 violation。
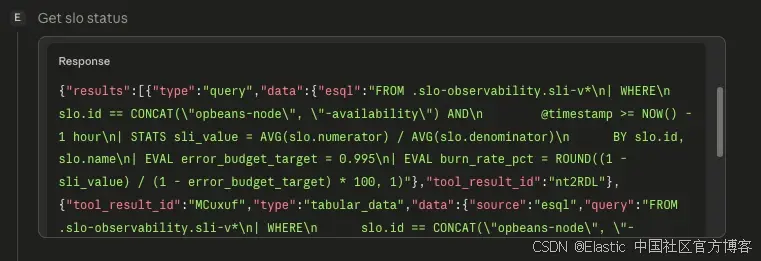
与之前查询 APM data 的 tools 不同,这个 tool 查询的是 Elastic 存储 pre-computed SLI data 的 internal SLO indices。该 query 会计算当前 burn rate,也就是 service 消耗 error budget 的速度,相对于允许 threshold 的比例:
{
  "id": "get_slo_status",
  "type": "esql",
  "description": "Returns the current SLO burn rate for a service over the last hour. The response includes: SLI value (current performance), error budget target, and burn rate percentage. The burn rate tells you how fast the service is consuming error budget relative to the allowed threshold. Interpretation: a burn rate below 100% means the service is consuming budget slower than the limit (sustainable). Between 100-200%, the service is burning budget faster than planned (proceed with caution). Above 200%, the service is burning budget at double the allowed rate (delay non-critical changes). Above 500%, investigate immediately. Note: this measures the current burn rate over the last hour, not cumulative budget consumption over the full SLO window. A temporarily high burn rate does not mean the overall budget is exhausted.",
  "tags": ["slo", "reliability", "budget"],
  "configuration": {
    "query": "FROM .slo-observability.sli-v* | WHERE slo.id == ?sloId AND @timestamp >= NOW() - 1 hour | STATS sli_value = AVG(slo.numerator) / AVG(slo.denominator) BY slo.id, slo.name | EVAL error_budget_target = 0.995 | EVAL burn_rate_pct = ROUND((1 - sli_value) / (1 - error_budget_target) * 100, 1)",
    "params": {
      "sloId": {
        "type": "keyword",
        "description": "The SLO identifier. Use the SLO ID for the service you are evaluating."
      }
    }
  }
}
关于 SLI index 的说明:
中的 version suffix.slo-observability.sli-v*取决于你的 Stack release(例如 Stack 9.3 中的)。请通过 GET _cat/indices/.slo-observability.*?v 进行验证,如果你的 cluster 使用不同版本,需要相应调整 pattern。
description 中的 burn rate interpretation rules 是最有价值的部分。一个原始数值比如 “burn rate 85%” 对开发者来说在没有 context 的情况下没有意义。这个 tool description 会把它转换为可执行的指导:“低于100%表示可持续,高于200%表示应该延迟非关键变更”。
通过 MCP 连接到你的 editor
当这三个 tools 都在 Agent Builder 中创建完成后,它们会自动通过 MCP server endpoint 暴露出来。只需要配置你的 MCP client 连接即可。
Claude Code 配置
将 Elastic MCP server 添加到你的 Claude Code settings:
{
  "mcpServers": {
    "elastic-agent-builder": {
      "command": "npx",
      "args": [
        "mcp-remote",
        "https://your-kibana-url/api/agent_builder/mcp",
        "--header",
        "Authorization: ApiKey your-base64-api-key"
      ]
    }
  }
}
Cursor 配置
对于 Cursor,在 Settings > MCP Servers 中添加该 server:
{
  "mcpServers": {
    "elastic-agent-builder": {
      "command": "npx",
      "args": [
        "mcp-remote",
        "https://your-kibana-url/api/agent_builder/mcp",
        "--header",
        "Authorization: ApiKey your-base64-api-key"
      ]
    }
  }
}
连接完成后,你 editor 中的 AI agent 会自动发现所有三个 tools。你可以通过提问来验证:“你有哪些可用的 Elastic tools?”agent 应该会列出 get_endpoint_health、get_recent_deploys 和 get_slo_status。
API key permissions:API key 需要具备 feature_agentBuilder.read Kibana API 权限以及对相关 indices(traces-apm.*, observability-annotations, .slo-observability.*)的 read access。用于 production 时,请将 key 的 expiry 设置为30–90天,并遵循 least privilege 原则。
场景:“现在合并这个 PR 安全吗?”
团队中的一个开发者有一个 pull request,把下游 service 调用在 中的 timeout 从 2 秒提高到 5 秒。在合并之前,他问 agent:
Developer:“我准备合并 PR #42,这个 PR 在 opbeans-node 中把 recommendations service 的 timeout 从 2s 提高到 5s。现在合并安全吗?”
agent 开始进行 multi-signal reasoning chain。过程如下。
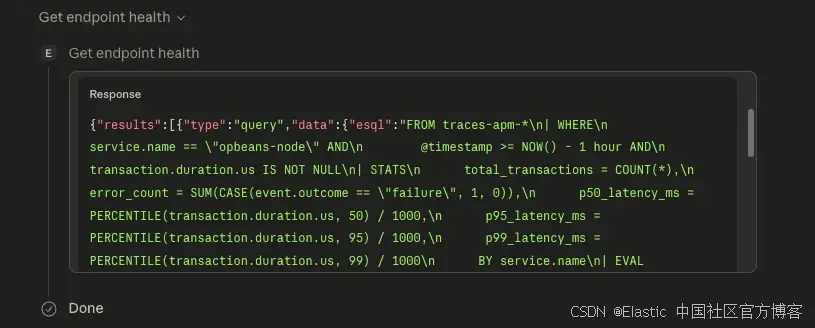
Step 1:agent 调用 get_endpoint_health
agent 首先检查该 service 的当前健康状态:
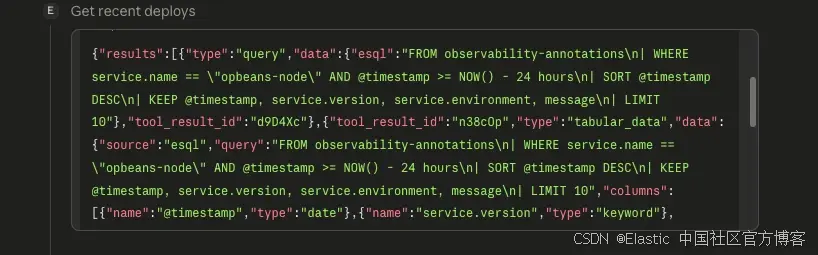
Step 2:agent 调用 get_recent_deploys
接下来,它检查最近的 deployments:
Step 3:agent 调用 get_slo_status
Agent 的响应
在将这三个结果进行关联分析之后,agent 输出如下建议:
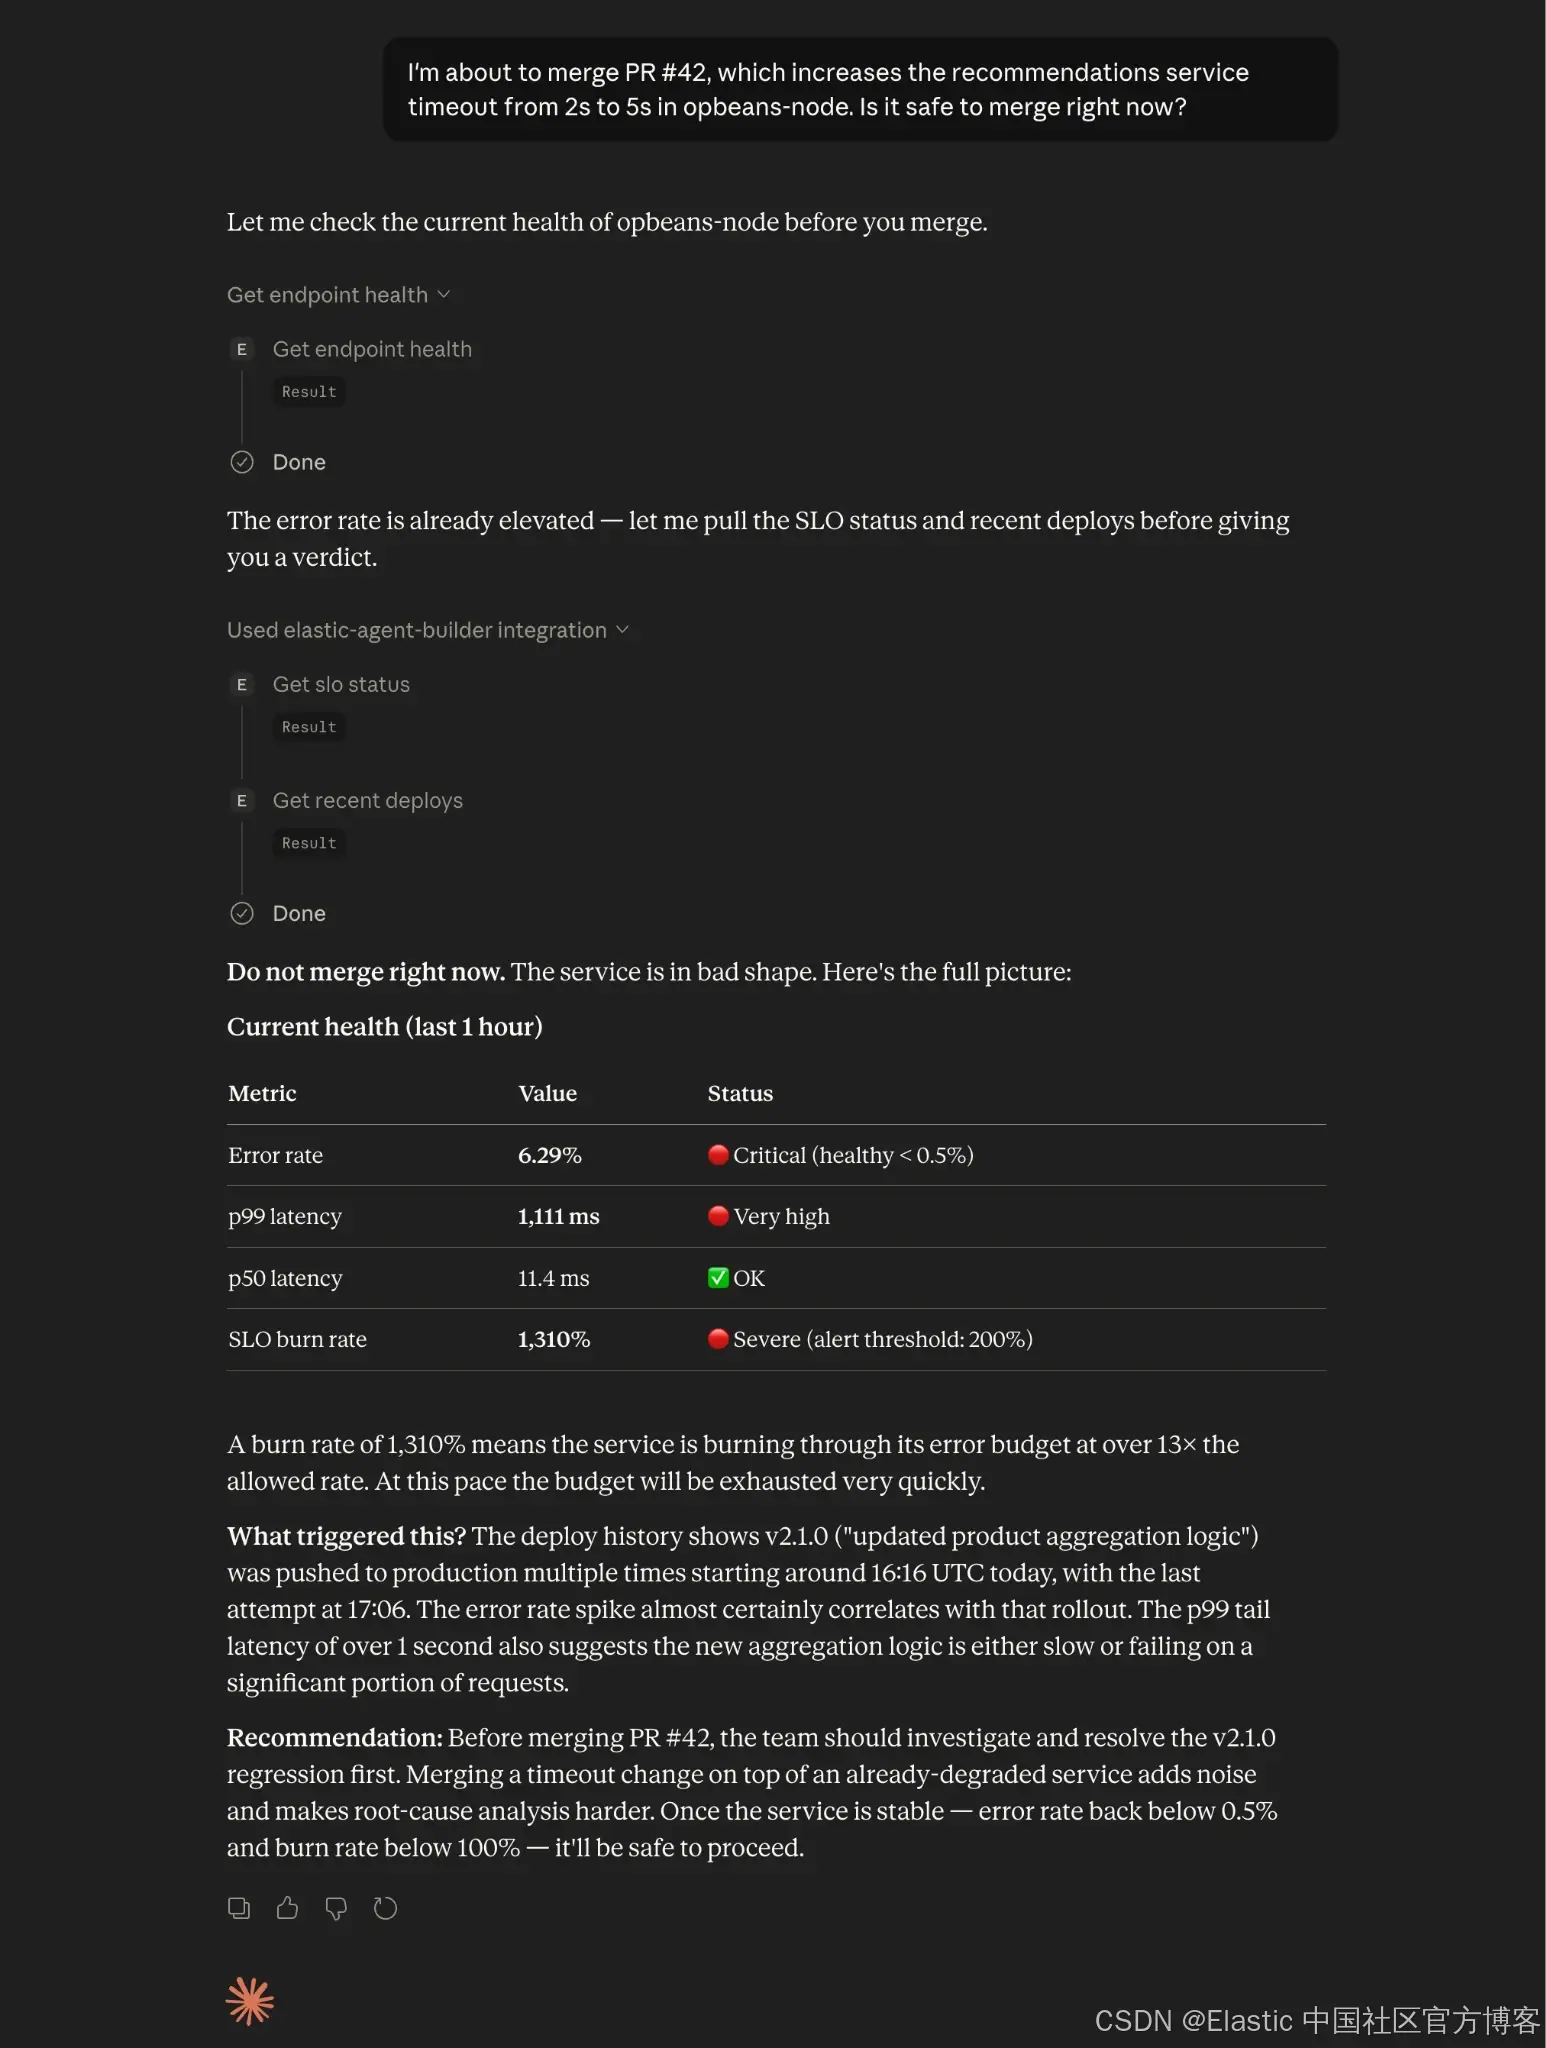
Agent 拉取了当前 p99,检查了 recent deploys,并读取了 SLO burn rate。它将这些 signals 与 PR 中的 timeout 变更进行关联分析,将该 merge 标记为 risky,并给出了后续建议。
结论:什么时候应该用 MCP tools 而不是 ping SRE
借助 Elasticsearch、Agent Builder 和 MCP,开发者可以在 editor 内部回答“现在合并这个 PR 是否安全?”这类问题,只需要几秒钟,而不需要去 ping SRE。Elasticsearch 保存所有 signals:traces、deploy markers 和 SLO budgets。Agent Builder 是 platform team 编码这些 signals 读取方式的地方:阈值、warm-up windows、以及 correlation rules。MCP 则负责把这些 tools 带入开发者的 editor。
query 负责拉取 data,而 description 告诉 agent 如何解读它。platform engineer 只需要写一次 runbook,团队中每个 developer 都可以直接使用。
下一步:将 Elastic Agent Builder MCP tools 扩展到 CI/CD
-
探索 Elastic Agent Builder documentation 获取更多 tool types 和 configuration options。
-
查看 Agentic CI/CD: Kubernetes Deployment Gates with Elastic MCP Server,将这一模式扩展到 CI/CD pipeline。
-
查看 Agent Skills for Elastic Observability,使用预构建 observability skills 的补充方案。
原文:MCP tools for Elastic Agent Builder — Elastic Observability Labs

欢迎加入 MCP 技术社区!与志同道合者携手前行,一同解锁 MCP 技术的无限可能!
更多推荐
 3
3 0
0- 0


 已为社区贡献28条内容

所有评论(0)